


What is Bollinger band's scalping strategy? How does it work? Is it a good strategy for trading in cryptocurrency? This article, which is written by Asia Signal experts, will answer these questions.
Digital currencies are highly volatile, but this volatility provides traders with many profit opportunities. People who are not afraid of high-risk strategies and spend most of their time monitoring price movements use scalp trading or consider it one of the preferred trading methods.
Bollinger Band is one of the standards and popular indicators for technical analysis of digital currencies, which can be used and combined with other indicators to obtain good buy and sell signals. In this Bollinger Bands guide, we introduce you to the appearance of this indicator, its components, different ways of using it, and how to interpret this popular technical indicator. In addition to this indicator, in this article, we will also examine the scalping strategy; scalping is a short-term trading strategy traders use to generate small, frequent profits based on daily price movements. Accumulating a small profit from each transaction becomes significant over time.
To be aware of the latest news related to cryptocurrencies, you can subscribe to Asia Signal's Crypto VIP signal channel. Check Crypto VIP Signal's membership terms and conditions.
What are Bollinger Bands?
Before introducing the Bollinger Band indicator, let us briefly talk about the history of its formation because this will help you understand it better. In the 1980s, a person named John Bollinger developed a type of indicator and was able to succeed in what we now know as the Bollinger Band Indicator.
Since Mr. Bollinger, with much experience in how to calculate price movements in the past of the market, succeeded in inventing it, and even today, this person is known as the most experienced technician in the financial market of the world. It should be noted that nowadays, the method of calculating parameters related to the Bollinger band indicator is simple and smooth.
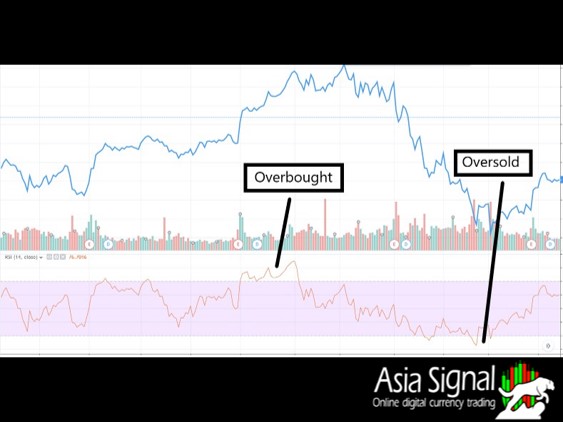
Bollinger bands are essential components in technical analysis. It is a versatile tool that uses moving averages and standard deviations to identify overbought and oversold areas of a product. Bollinger Bands is one of the most popular technical analysis tools.
Components of Bollinger Bands
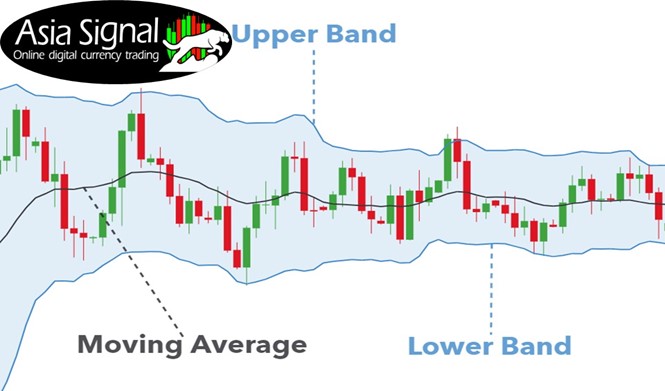
Before entering the stage of providing the necessary training to work with the Bollinger Band indicator, let us introduce you to the essential components of the Bollinger Band Indicator. In the following sections, we will discuss how to calculate these components. You should know that this indicator consists of 3 bands.
The three components of the Bollinger Band indicator:
Moving Average: By default, a simple 20-period moving average is used.
Upper Band: The upper band is usually two standard deviations (calculated from 20 periods of closing price data) above the moving average.
Lower Band: The lower band is usually two standard deviations below the moving average.
One of the primary and vital principles in predicting how prices move in the digital currency market is that when you apply unique settings to use this indicator in technical analysis, you should know that 9% of the time, Prices move between the sidebands.
Methods of using Bollinger Bands
Traders may use Bollinger Bands in three main ways. We will discuss these different interpretations in the following sections:
- Follow bands
- Following Bollinger Band breakouts
- Options contract volatility strategies
1. Follow Bollinger Bands:
The following bands are based on the assumption that the vast majority of closing prices should be between Bollinger bands. Commodity prices should rarely break out of the Bollinger Bands. Therefore, the price should not stay outside the bands all the time and should "return to the middle line." This median line is generally the same as the 20-period simple moving average.
Buying and selling exactly when the price hits the upper and lower Bollinger Bands is considered a risky trading approach. It may be better for the trader to wait and see if the price moves higher or lower than the Bollinger Bands. A potential buy or sell trigger may occur when the price returns to the Bollinger band and closes.
2. Following Bollinger Band breakouts
The opposite of "following bands" and hoping for the return of price to the midline is called following band breakouts. Breakouts occur after a period of consolidation and when the price closes outside the Bollinger Bands. When a trader decides whether to buy or sell an asset for a breakout, a trader can use other criteria, such as support and resistance lines.
Possible buying signal: Bollinger band price breakout from the resistance level
A trader may buy if the price breaks above the upper Bollinger band after a period of price stabilization.
The trader can use other confirmatory criteria, such as breaking the resistance level.
Possible selling signal: Bollinger band price breakout from support
In the same way, if the price breaks, the trader may sell below the lower Bollinger band. The trader can use other confirmatory criteria, such as breaking the resistance level. Bollinger bands can also be used to determine the direction and strength of the trend.
Bollinger Bands indicate a strong trend:
During a strong uptrend, prices remain in the upper half of the Bollinger Band, and the 20-period moving average acts as price trend support.
The opposite of this issue will be valid during the downtrend in such a way that the prices are placed in the lower half of the Bollinger band, and the 20-period moving average acts as the downtrend’s resistance.
Bollinger Bands adapt to volatility and are helpful for traders looking for options and swing.
3. Option volatility strategies
In this section, we explain how traders use Bollinger Bands to trade volatility-based options. A trader can trade on volatility in two main ways:
- Traders try to buy options with low volatility with the hope that price volatility will increase and then sell that contract at a higher price.
- Traders sell options with high volatility with the hope that volatility will decrease and then buy the same contracts at a lower price.
Using Bollinger Bands to trade on volatility
Because Bollinger Bands adjust to volatility, they can show the trader the relative expensiveness of options (high volatility) or the relative cheapness of options (low volatility).
Potential buy options when volatility is low
When options are relatively cheap, buying options contracts can be a good strategy. The reason is that after price movements, it may rest for a while in a neutral state. After a price break, such as during periods when the Bollinger Bands are very close together, the price may move again. Therefore, buying when Bollinger bands are tight together can be a brilliant strategy.
Potential buying options when volatility is high
When option prices are relatively high, and when Bollinger bands are wide apart, selling options can be a good option. This is because when the price has made a significant rise or fall, such as during periods when the Bollinger Bands are widely spaced, the price may begin to stabilize and become less volatile. Therefore, selling options contracts when the Bollinger bands are far apart can be a smart trading strategy.
It’s better to use signals for trading with the Bollinger band. You can check Crypto Signal Leaks on Asia Signal web for more information.
What is Scalp Trading?
Although the goal of swing trading is to make a profit in a period of several days to several weeks, the goal of scalp traders is to make a small profit in a period of several minutes to several hours.
In this method, the trader continuously follows the changes and fluctuations of digital currencies and seeks to gain profit by buying and selling large numbers in a short period of time. Since the profit obtained in each trade is small, traders increase their final profit by increasing the number of transactions.
Advantages and disadvantages of scalping strategy
The scalping strategy is one of the strategies that can bring high profit and minimize the possibility of loss in the digital currency market. Other advantages of this trading method include the following:
- Scalping is a suitable opportunity for people who do not want to hold assets for a long time.
- Beginner traders can choose scalping after acquiring the necessary knowledge about scalping and swing strategies to increase their skills and earn small profits.
- Due to the short trading time, the trader faces less risk.
But any trading method has some disadvantages scalping comes with some disadvantages, and traders should be aware of those disadvantages. Some of the disadvantages of scalp trading are as follows:
- People who do not have high mathematical skills and the appropriate speed of action may fail in the case of scalping trading.
- Using the scalping strategy to trade is stressful.
- The trader must follow the prices from moment to moment.
The basis of scalping
Scalping uses larger market position sizes to increase the price in the shortest holding time of the stock. Scalping trades are made throughout the day. The main goal is to buy several stocks at the bid price and then quickly sell them for a few cents higher or lower to make a profit. Holding time can vary from a few seconds to a few minutes and, in some cases, up to a few hours. This position is closed before the end of all market transactions.
Features of scalpers
Traders who use the scalping strategy are called scalpers. A scalper not only has enough skill and knowledge but also must have enough time to evaluate and study the changes in the digital currency market. Therefore, this trading method is not suitable for everyone and is only recommended for those who:
- They are interested in risk and excitement.
- They have the ability to make quick decisions in critical moments.
- They can spend much time behind the monitor checking charts.
It is also essential to note that traders need time to acquire sufficient skills in scalping trading. Therefore, it is better for beginners to use Scalping only to increase small profit at first.
The most accessible scalping strategies in digital currencies
The scalping strategy in digital currencies is based on technical analysis. A scalper must be able to take advantage of minor market fluctuations. The goal of this method is that the fluctuating person does not get involved in an investment in any way and only uses the benefits of increasing the volume of transactions and exits it with a small profit.
A number of digital currency scalpers use the five-second chart in their trades to check the available changes as much as possible from moment to moment. An active swing trader may make about 100 trades during the day.
For example, a scalper buys Ripple at $30 and sells it at $35 a few minutes or hours later. Then, when the price falls, he buys it again at $32 and sells it at $34. The best way to avoid heavy losses in a scalping strategy is to keep the Stop Loss close to the purchase price.
Common mistakes of scalpers
Some typical scalper mistakes are poor execution, poor strategy, not taking stop losses, using too much buying power, late entry, and late and excessive exits. Scalping generates heavy commissions due to a large number of trades. Of course, the per-share pricing structure is helpful for scalpers, especially for those who tend to trade the scale of smaller pieces in and out of position.
The best tools for scalping in the crypto market:
There are many tools that play an essential role in the success of traders. Some of these tools are free, and some are paid, although the non-free model is generally more practical and valuable. The best tools for scalping are:
Trading robots
Trading robots are the most popular software designed for traders. These robots are software that executes automatic transactions based on predefined criteria and a series of instructions. The trader can trade continuously with these robots so that the possibility of error is minimized and the chances of success are increased. 3Сommas and Haasbot are among the most popular bots for crypto trading that also support scalping.
Crypto API tools
APIs allow interaction with trading platforms and other blockchain projects. These tools provide users with various features, such as integration with wallets, support for transaction execution, tracking market rates, etc.
Crypto charts
Scalp trading is impossible without analyzing trading charts. The volume and price charts provide you with all the necessary information. In addition to these charts, tools such as stop limits help a lot in making rational decisions.
Bollinger band's scalping strategy
Combining the Bollinger band indicator with scalping is considered an important trading strategy. We use the MACD indicator in daily trading to determine the trend and the Bollinger Band as a trading trigger. MACD parameters are as follows:
- Moving Average (Fast EMA): 12
- Moving Average (Slow EMA): 26
- Signal line: 9
These standard settings exist in most software packages. The Bollinger Band setting is 12 for a moving average with a Bollinger Band standard deviation of 2.
In his article, Markus Heikkoeter used the S&P E-mini contract with a 4500-tick time frame. That is, a bar is drawn for every 4500 ticks. We follow this recommended schedule.
The trading day started with congestion before the bears entered (downtrend). This simple day trading strategy has been successful at the beginning of a bear market (downtrend). Finally, the price pushed the Bollinger band lower, the stop order trigger was pulled, and we made a profit.
How to recognize the price trend in training with the Bollinger band indicator?
It should be mentioned that how to correctly and accurately detect the price trend is one of the issues that we want to address in the Bollinger band scalping strategy because the issue of detecting the downward or upward trend line and whether the market is suffering can be considered one of the most challenging issues that Traders encounter it in the operation of technical analysis of the digital currency market. Although traders can filter their bad trades after identifying the mentioned trend, the primary issue is using the Bollinger Band indicator to identify the market trend. The following tips will help you to determine the price trend using the Bollinger Bands indicator:
At the beginning stage, apply two Bollinger indicators, one with ±1 Deviation and the other with ±2 Deviation, on the price chart.
Change the colors of the bands so that you can easily distinguish them from each other.
If the price movement was between Deviation +1 and Deviation +2, this indicates that the price has an upward trend.
If the price movement was between Deviation -1 and Deviation -2, this indicates that the price is in a downward trend.
If the price movement was between Deviation +1 and Deviation -1, this indicates that the price has entered a suffering trend.
According to the mentioned points, to determine the market trend, you can easily use the Bollinger band indicator in the operation of technical analysis and scalping strategy.
Market exit signal using Bollinger Bands
In this part of the article, Asia Signal experts intend to teach you a method that will enable you to exit the market at the right time. It should be noted that such an exit strategy is also called the 75% strategy. Since in the operation of technical analysis, finding the point of exit at the right time is more important than finding the point of entering the market at the right time, so professional traders, who enjoy a few percent profits only in digital currency, in particular, are always looking for a way. They aim to save and preserve their profits, which can be achieved if they find the exit points correctly.
You should know that if there is a mistake in finding the exit points, it is possible to lose all the profits. But don't worry; you can use the Bollinger band indicator to determine the correct exit point. The helpful tips to determine the exit point with the help of the Bollinger band indicator are that you must first follow how the market is trending in the rising part of the buying part that we mentioned in the previous part.
You should know that whenever a bearish candle is formed in the digital currency market so that at least 75% of the mentioned candle is placed in the lower part of the buying area, it can be said that you will be able to exit the market. But you should keep in mind that this output signal is correct only on the condition that the mentioned candle should be bearish.
Bollinger bands compression in scalping strategy
One of the strategies that professional traders usually use is Bollinger band compression. This strategy is straightforward; when the Bollinger Bands are compressed in an area, it means that you should expect a big swing in the market. This big move happens when the prince breaks out of one of the upper or lower walls. If the candles leave the top of the chart, you should buy them, and when they leave the bottom, you should take a sell position.
The reason behind this strategy is that after the price has fluctuated in a range and rested, it starts to move in the direction of a new trend.
In this part of the article, we want to introduce you to the compression strategy, which is one of the most widely used and essential strategies with a high percentage of confidence that professional traders use in the digital currency market. The essential and fundamental principle in this strategy is simple and convenient, and it is that whenever the price in question takes a compact state in a limited period and shows a slight fluctuation; as a result, you should know that after that moment, the price is going to enter a significant movement.
Important points that you should pay particular attention to when using the compression strategy:
In the first stage, you should continuously follow the desired price among the Bollinger bands.
When the desired price is compressed, in other words, it fluctuates a little in the desired period, you should take the necessary steps to enter the market.
Bollinger bands will be close to each other at such a time and, in other words, will be compressed to a great extent.
A hefty price move starts when you see the price break out of one of the lower or upper bands.
Whenever you see the price leaving the upper band, you can take the necessary steps to buy digital currency.
The use of the mentioned strategy in the digital currency market as well as in the two-way market that many traders use it. It should be noted that you can use this strategy to understand intelligent money better entering the digital currency market. You should also know that the basic principles of this strategy are that the desired price starts to move in the direction of a new trend after some time has passed since its volume has accumulated and after a period of rest.
The best settings for the Bollinger Bands indicator
Another critical point that we intend to discuss in this article is the importance of familiarizing yourself with the best and most productive type of Bollinger Band indicator settings and how to use it. In the first step, you should know exactly in which time frame you should use the indicator mentioned in the technical analysis operation. You should know that most traders fluctuate from the mentioned indicator in time frames that are short-term, for example, one hour or even less than this value. Although this indicator has the ability to trade in these short-term time frames but based on Mr. Bollinger's advice to use daily time frames, it is better to avoid short-term time frames. It should be noted that all the mentioned contents depend on the settings of the Bollinger band indicator; in order to set this indicator, it is essential to pay attention to the following points:
Suppose you want to use the Bollinger band indicator for trading in weekly or daily time frames. In that case, it is recommended to set the relevant, simple moving average to 20-18 and the standard deviation to 2.
Suppose you want to use the Bollinger Bands indicator for trading in short-term time frames. In that case, it is recommended to set the relevant, simple moving average to 12-9 and the standard deviation to 2.
How to trade based on Bollinger Bands?
A particular trading strategy should be adopted depending on whether the trend is up or down. When the trend is up, most analysts scramble to profit from that strong uptrend before it reverses. We also see a strong upward trend when the price constantly hits the upper band. When the price is in an uptrend and is unable to make a higher peak than the previous peak, traders tend to sell because this indicates that the trend is weakening and selling at this point prevents profit loss.
Bollinger bands are also used to determine the strength of the downward trend and to detect the probability of its reversal. When the downtrend is strong, the price moves along the lower band, indicating oversold. If the price moves below the midline and approaches the lower band, we see a strong bearish trend. In downtrends, if the price approaches the upper band, it means that the strength of the trend will decrease or a trend change is about to occur.
Most traders avoid trading in downtrends and look for an opportunity to buy and enter the market when the trend starts to reverse. Downtrends can last minutes or hours or even months. As a result, investors should follow the trend from the first signs of change. If the lower bands show a steady downward trend, avoid opening a bought deal.
Don't forget that prices tend to move between bands. This means the prize hits a band and then moves to another band. For example, imagine that the price hits the lower band and then crosses the moving average. In order to profit from these conditions, the goal should be to hit the upper band.
In strong trends, there is a possibility that the price will break out of the bands and sometimes stay there. But if the price quickly leaves the band and quickly returns to the band, it cannot be said that this trend is a strong trend.
For better trading, it’s better to use futures signals.
Scalping Trading Strategy vs. Daily Trading
Day trading and scalping are similar in theory but not the same. Scalping is a type of daily trading, but not all types of daily trading are scalping. The difference in time frame: While scalpers trade the market in an extremely short time frame, usually 1-2 minutes, daily traders trade the market in a longer time frame, usually 1-2 hours.
Account Size: Scalpers have a large account size and therefore bear high risk in the markets. On the other hand, daily traders have a medium account size and make large trades in their online trading accounts.
Market Experience: Scalpers know the market and can understand market trends. They make trades in the market without waiting for the result. They know where the market will go and wait to close trades to make a profit.
Results: The main difference between daily trading and scalping is when traders see results. Scalpers get their results instantly, while daily traders get them at the end of the day.
For better trading, we suggest you use the indicator crypto, and also Binance Spot Trading Signals will help you to have profitable trading with a scalping strategy.
The best time frame for scalping
The scalping timeframe determines the momentum of the trades or the number of transactions you make. Ideally, the best time frame for scalping is between 5 and 30 minutes. The shorter the time frame, the higher the number of possible trading setups. Be careful that this should be done completely based on the chosen strategy for scalping.
Here is an example with Bitcoin/USD. We used a 5-minute chart with a moving average (MA) indicator and chose a stochastic oscillator for momentum.
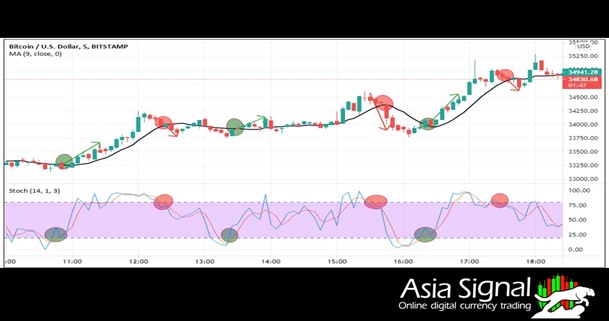
In this example, the scalper had six profitable trading opportunities within 7 hours, each of which was maintained for 30 minutes. And that's the wonder of scalping! You can use several trading opportunities in one day, in which the probability of profit is high.
Although scalping can be a profitable strategy, it is not without drawbacks, and the biggest drawback is transaction execution costs. Crypto trading, in this way, costs many fees for the trader, which can significantly reduce the overall profit. Scalpers must have much mental stamina to face the pressure and high speed of crypto scalping. Ultimately, doing this requires sticking to a strategy and controlling emotions.
Risk management with scalping
Based on specific settings, any trading system can be used for scalping purposes. In this regard, scalping can be considered a kind of risk management method. Basically, any trade can be converted by taking a profit close to a 1:1 risk/reward ratio. This means that the size of the profit taken is equal to the size of the stop dictated by the trade initiation. For example, if a trader enters a position for a scalp trade at $20 with an initial stop at $19.90, the risk is $0.10. This means a 1:1 risk/reward ratio of $20.10.
Scalping trades can be done on both extended- and short-term terms. They can be done on breakouts or on limit trades. Many chart patterns, such as cup and handle or expanding triangle, can be used for scalping. The same can be applied to technical indicators if the trader makes decisions based on them.
Is Bollinger band's scalping strategy suitable for everyone?
Definitely not. If you are new and have just entered the crypto ecosystem, it is better to look for less risky methods such as medium to long-term investment. But if you are comfortable with this system and are ready to use the scalping of trading, scalp trading in the crypto market can be a good option for you.
Conclusion
Indicators are tools based on price. That is, they consider the behavior of the price in the past of the market, and based on them, they provide charts that help the analysts to have a more accurate prediction of the market movements in the future. But since these indicators are derived from the price, it is better not to use them alone and only to get confirmation. Scalping is known as one of the most effective strategies in the digital currency market. However, it is better for traders to go for this method, who have enough skills and experience. Bollinger band indicator is not an independent trading system and only gives you quantitative fluctuations. In fact, the Bollinger Band indicator is a reactive indicator and has no predictive power. In addition, this indicator is lagging because it only works based on a simple moving average, which also takes the average of several bars or candles. This issue is considered one of the limitations of the Bollinger band indicator. Bollinger bands can be used to identify and measure the trend, but it is not possible to achieve an accurate analysis by relying only on this indicator, and it is necessary to combine it with other indicators, but in general, it can be said that the combination of this indicator and the scalping strategy has been able to minimize the loss for beginners in the digital market.
As Asia Signal experts are professionals in investing, you can get help from them. You can be our VIP member by joining our Crypto VIP Signal channel and getting informed about Crypto Signal Leaks news as soon as possible; for more information, check the crypto signal.


Comments