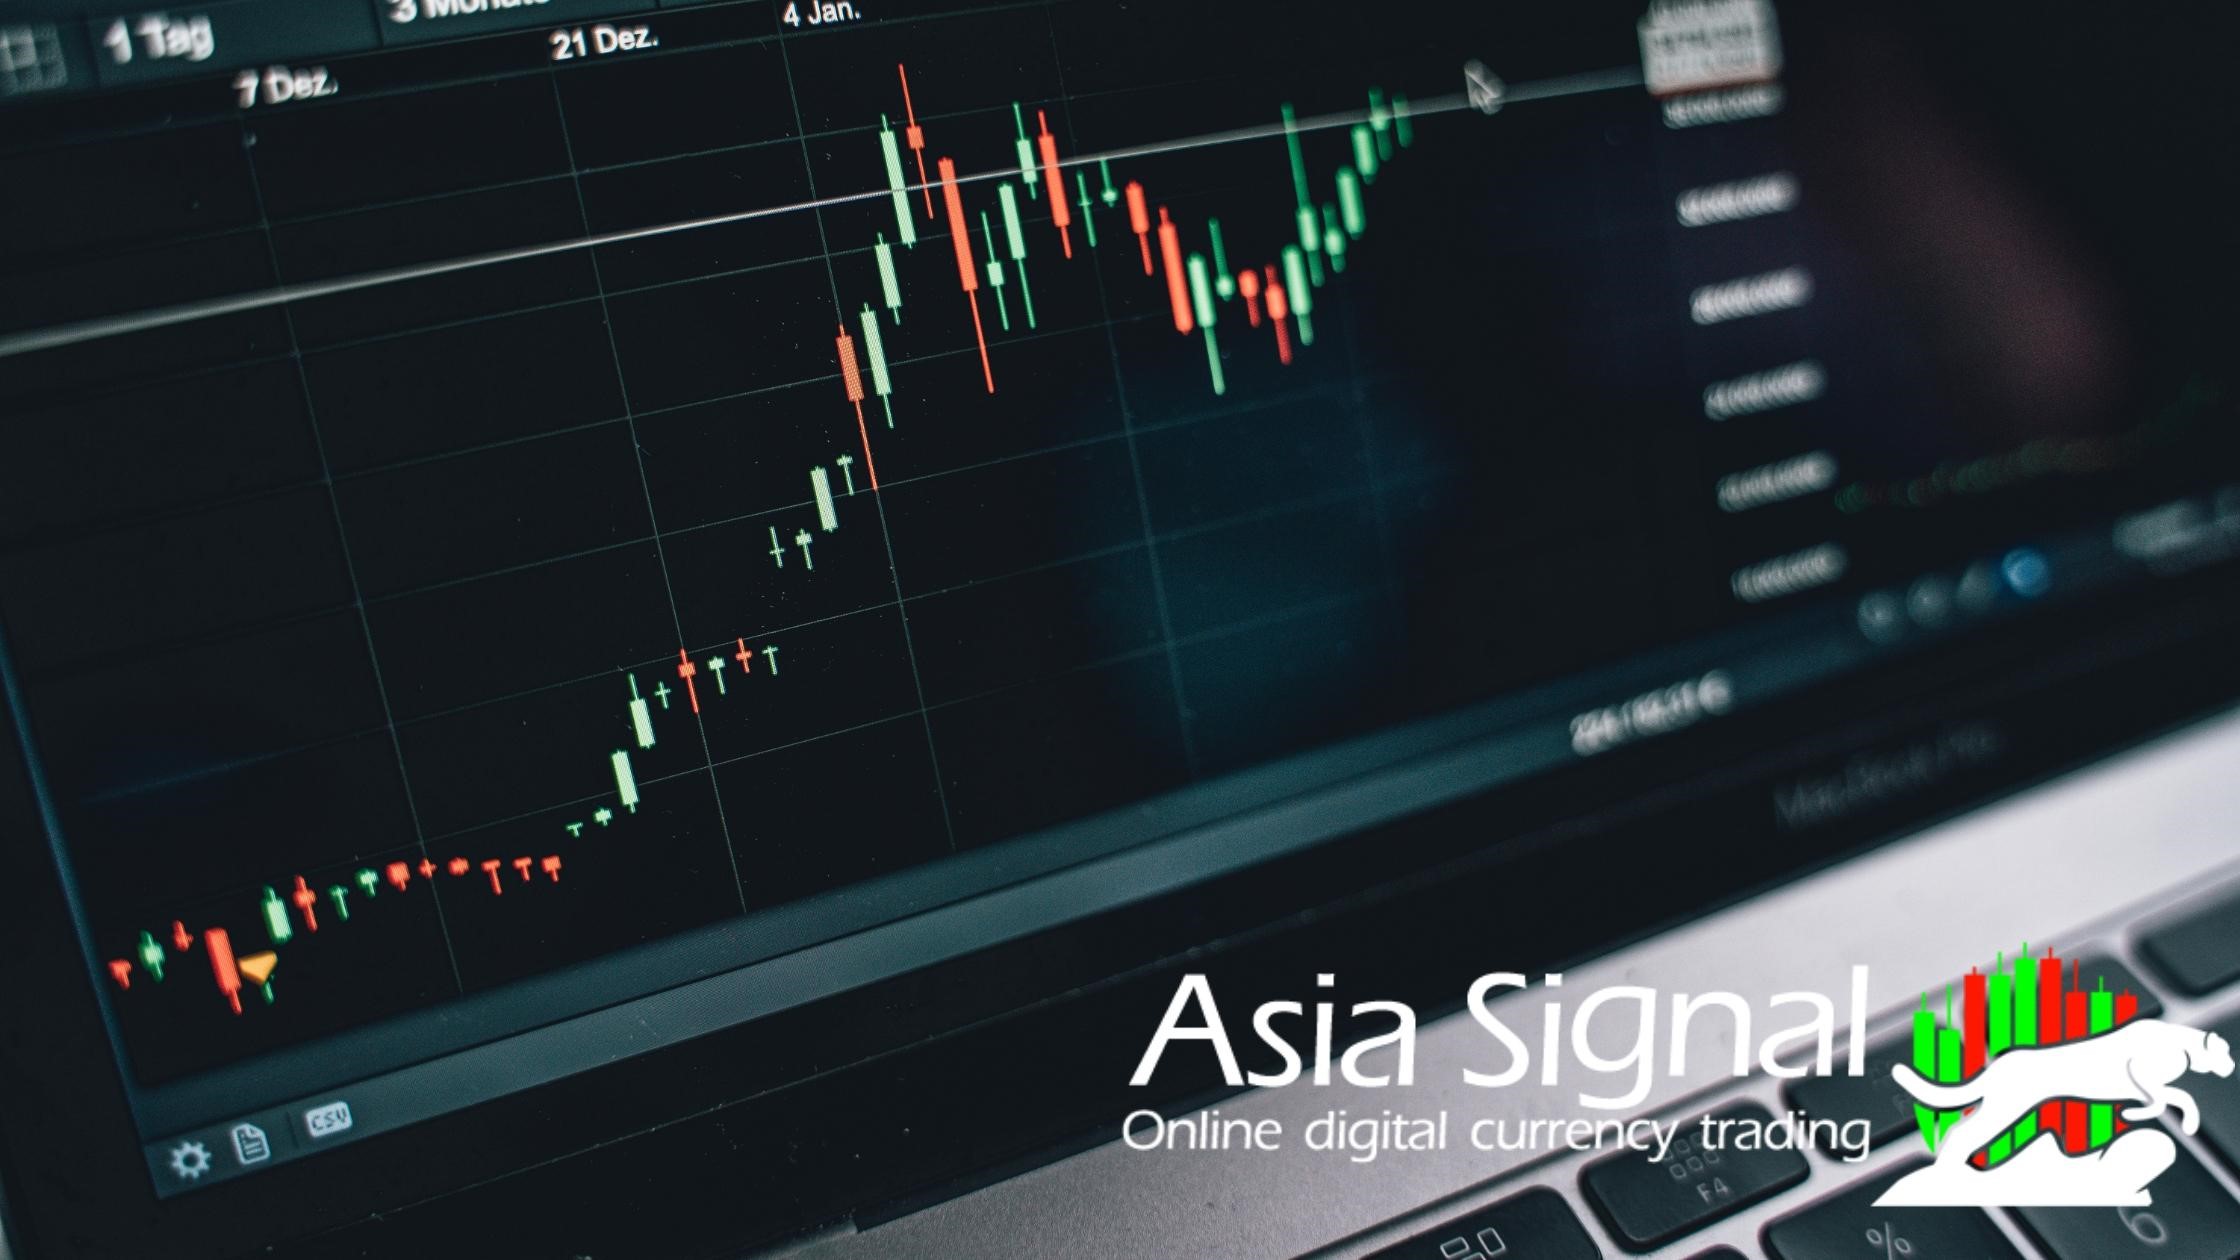
Whether you are interested in the world of digital currency and want to invest in it or you are a technical analyst in the field of digital currencies, the first thing you should learn is the digital currency candlestick. Read and share this article about candlestick charts with other people who want to learn about candlestick charts because they are so important.

Digital currency candlestick charts reading
In the technical analysis of digital currency, there are some types of charts known as candlestick charts, which are also called Japanese candles. Why is it called Japanese candle? Because for the first time in the 18th century in the small markets that existed in Japanese cities, this method was used to analyze the feelings of rice buyers and sellers, and accordingly, the amount of supply and demand was changed and based on them.
Each part of these charts that includes a time segment is called a candle, which conveys more specific information to the reader than a line chart. How to read these candles will help you have a proper analysis of your digital currency or type of investment so that you can get the most profit from it.
Cryptocurrency candle reading trading
As we said, candlestick analysis in digital currency is one of the most important methods of cryptocurrency market analysis. In the following, we have talked about the types of candles in the cryptocurrency market.
How to read stick candles
So far, we have found that with the help of a candle and various parameters, you can understand the market movement, the opening and closing price, the highest and the lowest price, and whether the market is linear or non-linear. Most traders try to read stick candles to understand the general movement of the market. These analyzes are daily, weekly and monthly. You can also have one-hour analysis and estimate long-term events based on them.
The difference between candlestick, line and bar charts
A line graph is actually a connected line and is created by joining the endpoints at any point in time. Let's say you want to have an hourly chart. In this case, at the end of each hour, a closing price is determined on the chart. If these lines are connected, a linear chart is created. A line chart is actually a quarter of a candlestick chart. In the line chart, you can't see the opening and closing price, the highest and the lowest price, and you can only find out the price in that time frame.
In a bar chart, all the information shown is exactly like a stick chart, but the way they are displayed is different. In the bar chart you will not have a body and the whole chart is just one line as you can see in the figure below. Most of the analysts use candlestick charts because they have a more understandable appearance and they can do their analysis better.
Candlestick patterns
With the passage of time and as a result of the price changes that happened in the candles, patterns have been formed that can be used to identify the main support and resistance columns. Most analysts use these patterns to announce their predictions about the price of digital currencies and even change the market trend in some cases.
There are many patterns for candlestick charts, and in this article, we will mention the most important ones. Many candlestick patterns show a specific state of the market, some of which are analysis of the current position and the balance between buying and selling of the market, and some of which are changes in the direction of the market.

A variety of candlestick patterns
Marubozu pattern: indicates that the trading direction is on the same side. This candlestick is shown with only one body, and if it is green, it means that buyers have controlled the price of the currency from the opening of the candle to the end of the desired time period, which indicates that it is very bullish. If it is red, it means that the sellers controlled the price from the opening of the candle to the end of the time frame, which indicates that the chart is too bearish.
Doji pattern: One of the most important patterns in digital currency candlesticks is the Doji pattern. When the open and close occur at approximately the same point in the market, the candlestick will look like a + sign, with a very small one-line body and very short upper and lower shadows. This type of candle is called a Doji. This candlestick actually shows conflicts between buyers and sellers, which has no net benefit for either side and is considered a neutral signal. This candle can be both continuation and changer.
Tombstone Doji Pattern: This pattern is known as a bearish candlestick in digital currency candle analysis. This candle is formed when the opening price, closing price, and low price are all close to each other, but there is a long upper shadow compared to the other three numbers. This pattern is created just before a long-term trend.
Hammer pattern: Another pattern in cryptocurrency candlesticks is the hammer pattern. The Hammer pattern has a short body and a long lower shadow that is usually placed at the end of downtrends. The hammer pattern indicates that there has been an increase in price during the day and the chart will go up.
Inverted Hammer Pattern: Another bullish pattern is the inverted hammer pattern, the only difference with the hammer candlestick is that the upper shadow is longer and the lower shadow is shorter. Whenever you see this candle in the market, it is predicted that buyers will soon take control of the market.
Dragonfly pattern: Dragonfly pattern is another candlestick pattern for reading candles in digital currency. It is a type of candlestick pattern that depends on previous price action. This pattern can indicate whether the price is going to trend up or down. In this pattern, the opening, closing and high prices are in a close range, but the lower shadow is long.
Three White Soldiers Pattern: The 3 White Soldiers pattern occurs over 3 days or 3 trading periods. These patterns consist of long continuous green candles with a short shadow that have an exponentially higher opening and closing price than the previous day. The bullish signal of this pattern is very strong, which is usually observed after a downward trend and indicates the market is bullish. This pattern indicates a continuous increase in buying pressure.
Comet pattern: This pattern, also called shooting star, has a structure similar to the reverse hammer pattern in digital currency candlesticks. This pattern has a smaller lower body and a very long shadow and is generally formed when the market opens at a higher point and closes at a price slightly higher than the opening price. This pattern indicates a downward movement.
Spinning Top: Another pattern in digital currency candlestick is Spinning Top. This pattern is somewhat similar to a Doji but has a small body and long shadows. This pattern shows the uncertainty of the market and does not include significant changes. With the help of this chart, you can understand that the bulls raised the price and the bears drove it down again.

pattern in digital currency candlesticks
Bearish engulfing pattern: This pattern is the complete opposite of bullish engulfing and is formed at the end of an uptrend. The first candlestick is green, which is created at the end of an uptrend and has a small body, and this candlestick is covered by a long red candlestick placed after it. This pattern indicates a decrease in the speed of price movement, and the lower and higher the second candle is, the greater the trend change will be.
Three Black Crows Pattern: This pattern consists of three consecutive long red candles with short shadows or no shadows at all. Each candle has the same price as the previous day, but the pressure to sell the price decreases with closing. According to analysts, this pattern indicates a downward trend because sellers have surpassed buyers in three consecutive trading periods.
Covering Black Cloud Pattern: This pattern indicates a market change from an uptrend to a downtrend. This pattern consists of two candlesticks, one of which is green and relatively large, and the other is red. The red candlestick closes above the closing price of the open green candlestick and below half of the previous green candlestick. This pattern indicates that bears have taken over the market and prices are extremely low. If the shadows of the second candlestick are short, it means that the downward trend it has taken will be more intense.
Sandwich Stick Pattern: This pattern is another candlestick method in digital currency. The sandwich stick candlestick pattern is one of the bullish reversal patterns that stops the downward trend and there is a possibility that the price will increase after seeing this pattern. This pattern consists of three candles, the opening price of each of which is higher than the closing price of the previous candle.
Dove Reversal Pattern: This pattern appears when the market is bearish and selling pressure is high. This pattern consists of two candlesticks, one of which is a long bearish candlestick and the second candlestick indicates the subsidence of sales transactions. This pattern in digital currency candlesticks does not mean the return of the trend and we can hope for the price to rise.
How to trade digital currency with candlestick?
Above, we introduced the most important and well-known patterns of the digital currency market. Now let's talk about how to trade in digital currency with the help of candlesticks. These patterns alone are a signal for long-term and short-term positions, but you should know that no analysis is 100% correct and even the most experienced people in the field of digital currency analysis can make mistakes. Just reading strategies and patterns can help us make more accurate predictions. Sometimes, to have a more accurate forecast, you have to combine several methods to achieve a more accurate profit.
In many cases, the closing time of the daily digital currency candle is important, or even events such as the American elections, the words of one of the whales in the field of digital currency, the tweets of famous people in the field of digital currency, the restriction or removal of restrictions on having a digital currency exchange in any country can affect the price of the currency. Digital has a direct or indirect effect.
Last word
Whether you use classic digital currency methods or look for modern methods for analysis such as price action or digital currency candlesticks and candlestick patterns, you should know that analysis is not a 100% thing. It is also necessary to know that analyzing only with the help of candlestick patterns is not the right thing and it will not give accurate results, but traders are always looking for the most reliable signals with the help of which they can find their desired strategy.
We are here to day you that Asiasignal’s VIP channel can be the best choice if you are beginner or professional trader because Asiasignal’s VIP indicator is for everyone. You can experience the best analysis with premium account of trading view.


Comments