Unraveling the Patterns: Exploring the Symmetrical Triangle in Technical Analysis
In the world of financial markets, patterns often hold the key to understanding and predicting price movements. Among the numerous patterns identified by technical analysts, the symmetrical triangle stands out as a captivating formation that provides insights into potential future price trends. This geometric pattern is revered for its ability to depict the delicate balance between bullish and bearish forces within a market. In this article, we delve into the intricacies of the symmetrical triangle, understanding its formation, interpretation, and significance for traders and investors.
The Symmetrical Triangle Defined
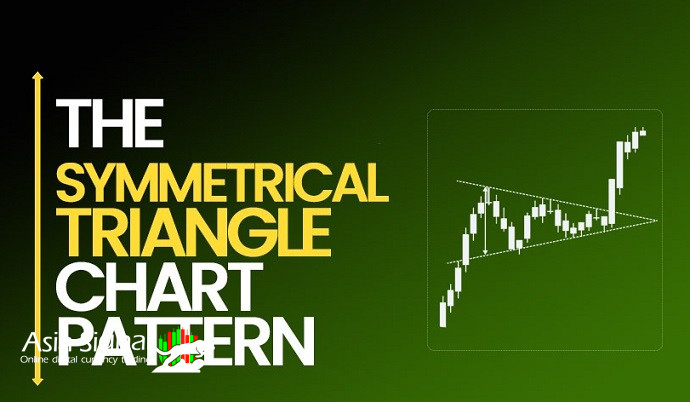
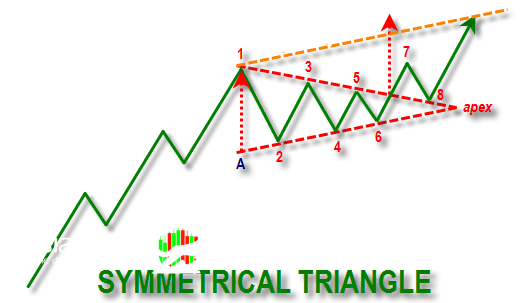
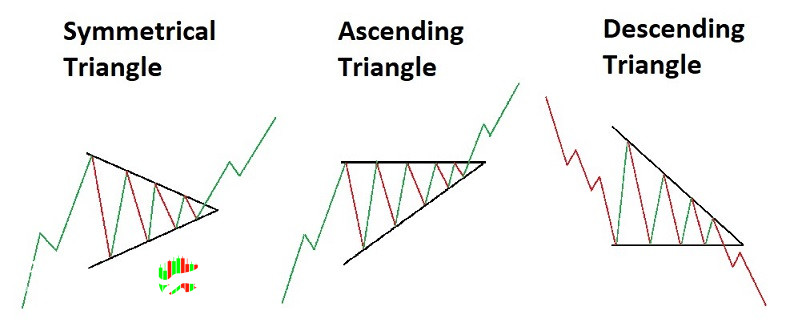
The symmetrical triangle is a price pattern that occurs when two converging trendlines bound the price action, forming a triangle-like shape. This pattern reflects a period of consolidation, where the highs are gradually getting lower (forming the upper trendline) and the lows are gradually getting higher (forming the lower trendline). The convergence of these trendlines signifies a balance between buyers and sellers, resulting in a tightening range of price movement.

Formation and Duration
Symmetrical triangles typically emerge during periods of indecision in the market. Traders and investors are uncertain about the future direction of the asset's price, leading to a series of lower highs and higher lows. This narrowing price range indicates diminishing volatility as the pattern matures.
The duration of a symmetrical triangle can vary, ranging from a few weeks to several months. The length of time the pattern forms can provide insights into the potential strength of the breakout that follows. Generally, longer consolidation periods tend to lead to more significant price movements once the pattern resolves.
Interpreting the Symmetrical Triangle
Technical analysts approach the symmetrical triangle pattern with keen interest due to its predictive potential. While the pattern itself doesn't guarantee a particular outcome, it often serves as a precursor to a significant price breakout. There are two potential scenarios associated with the symmetrical triangle pattern:
1. Bullish Breakout: A bullish breakout occurs when the price breaks above the upper trendline of the triangle. This suggests that buyers have gained the upper hand, and the asset's price is likely to experience an upward surge. Traders often set price targets based on the height of the triangle added to the breakout point.
2. Bearish Breakout:Conversely, a bearish breakout unfolds when the price breaks below the lower trendline. This implies that sellers have taken control, and the asset's price might experience a downward move. As with the bullish scenario, traders can set price targets based on the triangle's height subtracted from the breakout point.

Confirmation and Caution
As with any technical analysis pattern, false breakouts can occur. To reduce the risk of falling victim to a false signal, traders often wait for confirmation before entering a trade. Confirmation involves waiting for the price to decisively move beyond the breakout point, ideally accompanied by significant trading volume. This volume confirmation helps validate the strength of the breakout and reduces the chances of being caught in a market whipsaw.
The Significance for Traders and Investors
The symmetrical triangle pattern holds significance for both short-term traders and long-term investors. Traders may utilize this pattern to identify potential trading opportunities, aiming to capitalize on the price movements that follow the breakout. On the other hand, investors might use the pattern to time their entry or exit points for long-term positions, considering the potential for trend reversals or significant price movements.

In Conclusion
The symmetrical triangle pattern embodies the tug-of-war between buyers and sellers, creating a visual representation of market indecision. Its formation can herald exciting opportunities for traders and investors alike, with the subsequent breakout offering the potential for profitable trades. However, it's important to remember that no pattern is foolproof, and risk management should always be a priority when engaging in trading or investing activities. As with all aspects of technical analysis, combining pattern recognition with other forms of analysis can provide a more comprehensive understanding of market dynamics.
Looking for Leaked crypto signals? AsiaSignal has provided the best for you


Comments