


The capital market is a specialized market and, of course, to be successful in this market, expertise is needed to determine the value of a share. Technical and fundamental analysis are considered famous analyses. Of course, market psychology and table reading can also be added to these analyses.
Which method of analysis is more suitable can be understood by examining their advantages and disadvantages. Of course, mastering both types of analysis is very important for success and sustainable profit.
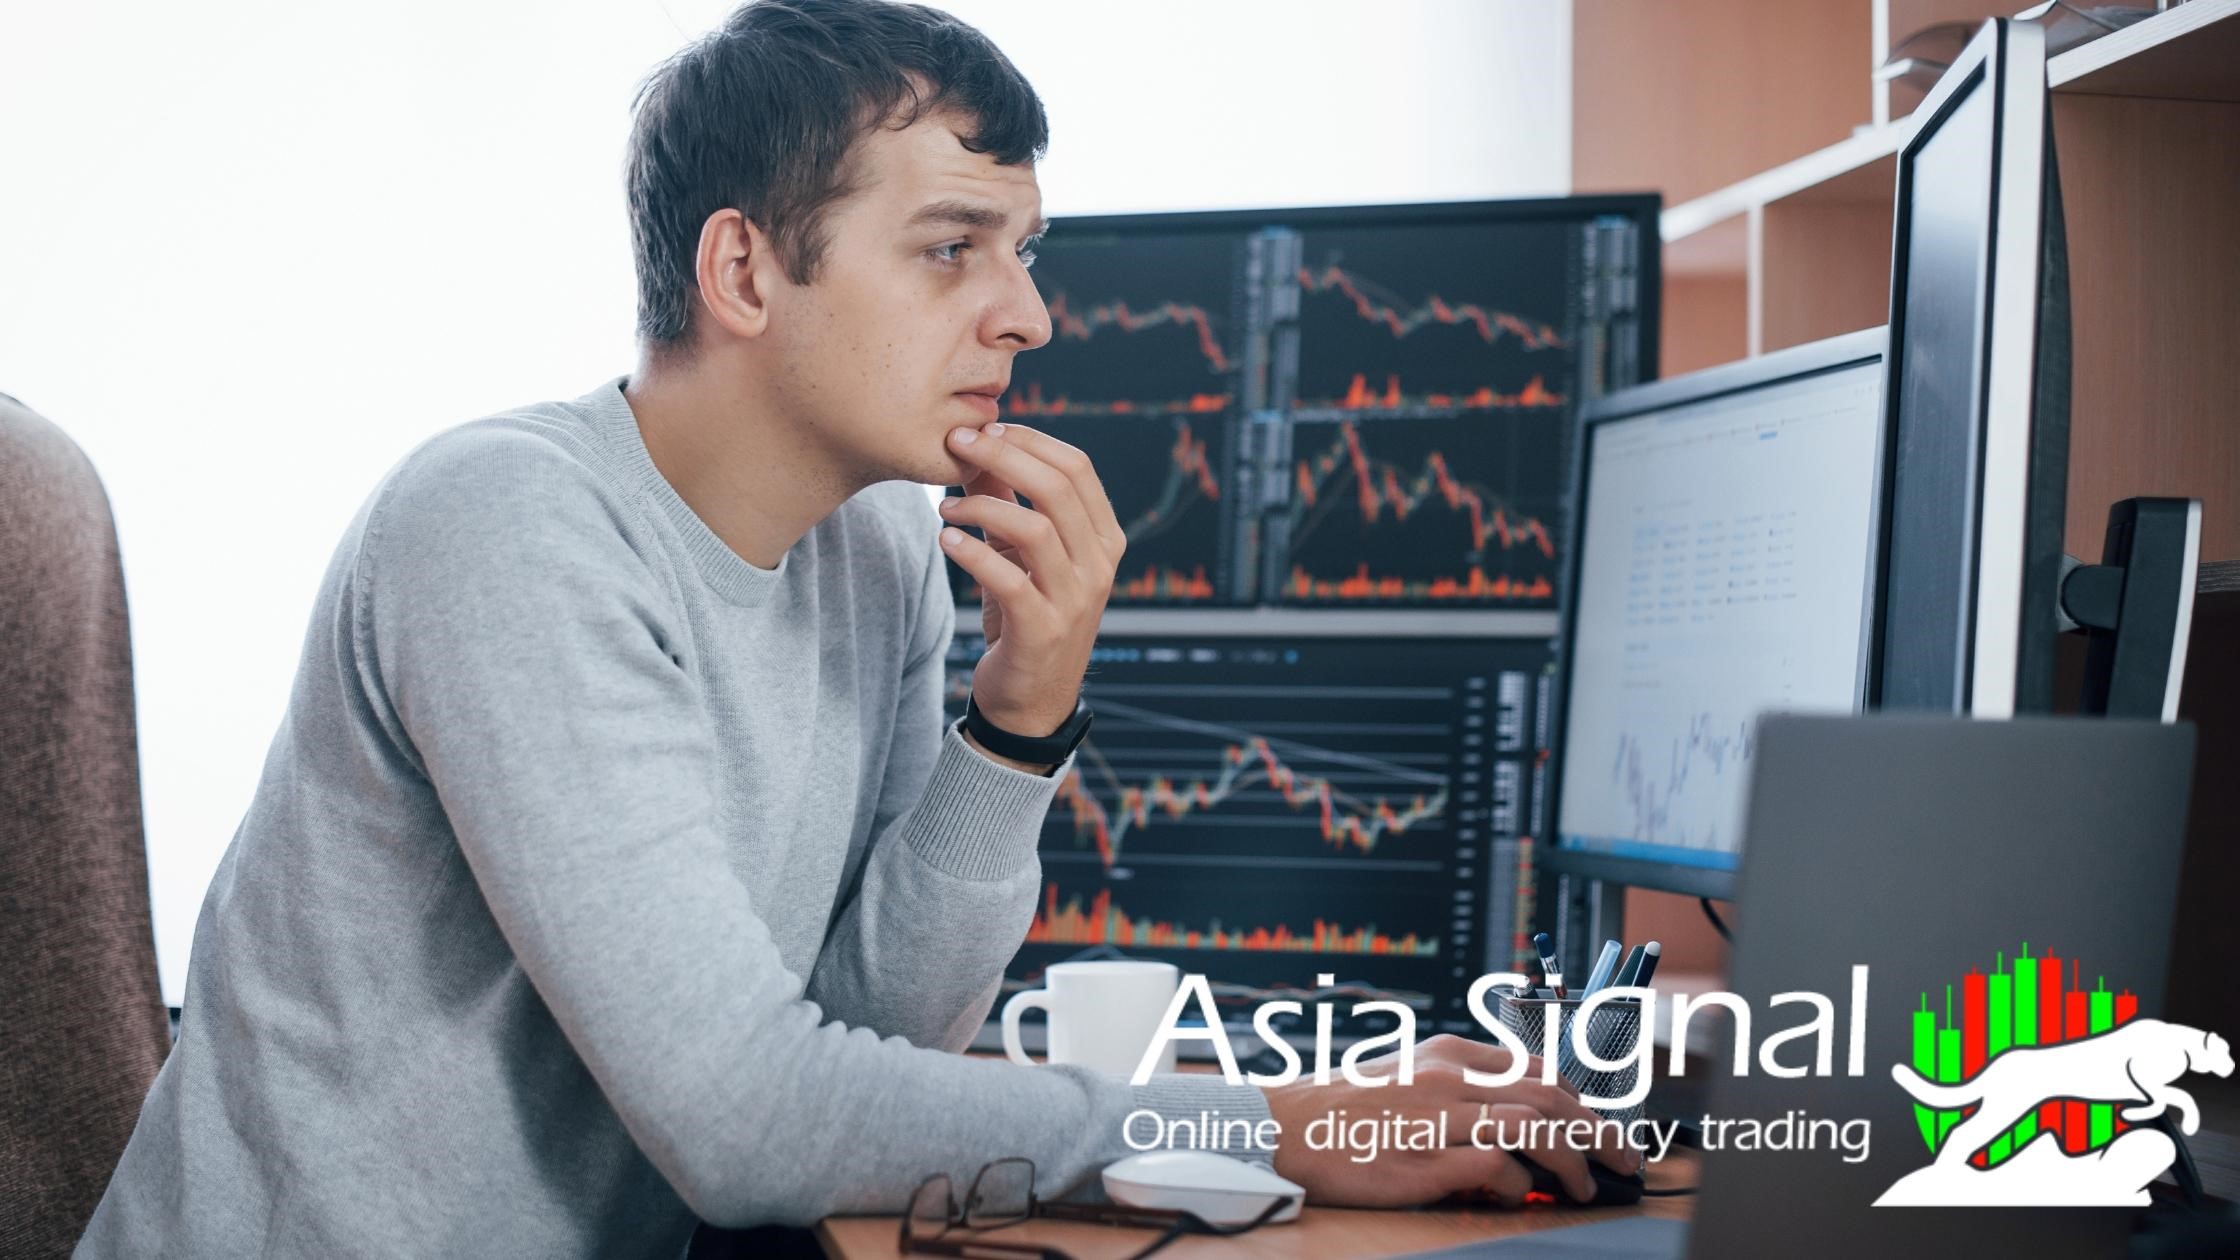
Price action is one of the most practical methods of technical analysis that examines stock price movements. For this reason, we have planned a price action training course for you at Asiasignal. Also, please read and share these and other articles of our website with other people who want to become more familiar with price action and other similar topics. Asiasignal is a great website for everyone who wants to gain detailed and correct information about digital currencies, meme coins, price action and candlestick in a short period of time.
What is price action?
If we want to provide a simple definition of price action, it should be considered a method of analysis in which price data is the main criterion for analysis. Price action actually examines price movements. By using these price movements, the trader can recognize the trend and his entry and exit points in the transaction.
One of the features of the price action technique is that it is free. That is, you only need one candlestick chart for your technical analysis, which is provided by various sites. In this type of technical analysis, you don't need an indicator and all the steps are done using price fluctuations.
Also, this technique shows us that nothing in the stock market or capital market is random and all ups and downs follow a specific trend that can be predicted by price action science and price action analysis training.
Traders who use this technique are usually people who see everything as simple and they are called price action traders. Keep in mind that the price action strategy does not need to learn a special software because by using a series of simple principles and techniques You can find the points of resistance, support, etc. and buy and sell based on your strategy and goals.
A very important point in this method is that by learning this method, you can invest in other capital markets such as forex. Also, price movements are an all-round technique. It shows us how to check them.
Price action is one of the most awesome trading strategies. In fact, price action is the basis of all technical analysis of stocks, commodities or other asset charts. Many short-term traders rely only on price action and the formations and trends estimated from it to make their trading decisions.
Technical analysis is derived as an action from price action; Because it uses past prices in calculations and can then be used to inform trading decisions.
What does price action say?
Price action can be viewed and interpreted using charts that plot prices over time. Traders use a combination of different charts to improve their ability to track and interpret trends, breakouts, and reversals. Many traders use candlestick charts; Because these charts help to better visualize the price movements by displaying the close, low, high and open values in the context of high or low sessions.
Candlestick patterns such as Harami cross, engulfing candlestick pattern and three white soldiers' pattern are examples of visually interpreted price action. There are more candlestick patterns created with price action to set up what is to come next. The same patterns can be applied to all types of charts, including scatter charts, figure charts, box charts, and more.
In addition to visual patterns on a chart, many technical analysts use price action data when calculating technical indicators. The purpose of doing this is for analysts to find a regular pattern in the sometimes seemingly random movements.
For example, an ascending triangle pattern is formed by using the trend line in the price action chart. This chart may be used to predict a potential resistance breakdown; Because the price action shows that the bulls (investors who believe the stock price will rise) have broken resistance several times and gained more momentum each time.
You may ask why the price action method is focused on the price?
The answer is that various factors affect whether a share is positive or negative. These factors can be economic, psychological, technical and even information (rent). But all these factors will eventually lead to buying or selling, which will be reflected in the stock price on the trading board.
In this method, we are faced with a clean chart that provides suitable results to the analyst by considering factors such as price, volume and stochastic candles (Japanese candlestick chart). Simply put, price action is a trading and market analysis technique that allows the trader to make trading decisions using actual price movements.
Meanwhile, indicators that are always behind the current market price analyze price movements (of course, this sentence does not mean that using indicators for analysis and trading is not appropriate). Most indicators lag the current market price and actually show the analysis of past price information.
The advantage of using the price action technique
Most traders are interested in using price action. Because using price action to analyze the market is relatively easy and not very complicated, and the method of trading with price action can be learned with a little study and research. For this reason, even if people are not fully proficient in analysis techniques, they can use it to gain profit.
On the other hand, traders in this technique get comprehensive information from the market, which helps them to make their transactions with the least amount. Using this technique in addition to helping you gain a correct understanding of market performance; Rather, it will allow you to succeed in any market, including the digital currency market.
Another advantage of Price Action is that it is free and has no software limitations, and there is no data interference. For other related topics, please read our other articles on Asiasignal.
How to use Price Action?
Price action is not commonly seen as a trading tool like an index, but rather a data source from which all tools are built. Float traders and trend traders usually tend to work with price action and avoid any fundamental analysis that focuses solely on resistance and support levels to predict breakouts and consolidations.
Even these traders should pay more attention to other factors beyond the current price; Because the volume of transactions and the time frames used to determine the level have an effect on the probability of their interpretation being accurate.
What are the necessary tools for price action trading?
Since price action trading is related to recent historical data and past price changes, all technical analysis tools can be used according to the trader's choice and strategy. These tools include charts, trend lines, price bands, swing highs and lows, technical levels (such as support, resistance, and consolidation), etc.
The tools and patterns observed by the trader can be simple price bars, price bars, resistance breaks, trend lines or complex combinations including candlesticks, swings, channels, etc.
Psychological and behavioral interpretations and subsequent actions also form an important aspect of price action trading. No two traders interpret the same price action in exactly the same way. Because each of them has its own interpretation, defined rules and different behavioral interpretations of it.
In fact, price action trading is a systematic trading action that traders can make with the help of technical analysis tools and recent price history, according to their mental, business, behavioral and psychological situations in a given scenario.
What are the limits of price action?
Price action analysis is completely subjective. It is normal for two traders to come up with different results when analyzing the same price action. One of them may perceive the price action as a bearish downtrend, and the other may believe that the price action indicates a potential short-term reversal.
Of course, the time period used also has a significant effect on the interpretation of traders. For example, a stock may have a downward trend daily, but the same stock may have an upward trend this month compared to the previous month.
The important thing to remember is that predicting trades using the price action technique on any of the time scales is nothing more than speculation; Therefore, the more tools you can use to verify it, the better your trade prediction will be.
However, price action, apart from security, has no guarantee for the future. High probability trades are still speculative trades; This means that traders take risks to achieve potential rewards.
Identifying the main market trends
The most important point in trading with the price action method is to be able to identify the main trend of the market and find out that the price of a cryptocurrency or an asset has an upward or downward trend or is so-called without a trend and suffers in a certain range of prices.
Obviously, every trader knows that the chances of success in a market that is rising will be higher than in a market that is suffering and stabilizing the price, and it is logical that in order to make a profit from that financial market, one should invest in such a market. In order to be able to recognize such a situation and experience profit, we must practice repeatedly and acquire the necessary information.
Detecting bear/bull markets
If you look carefully at the bull market charts, you will find that the new price ceilings are higher than the old price ceilings and the new price floor will be higher than the old price floor. In the same way, if the market has a downward trend, we will see that the new price floors will be lower than the previous price floors and the new price ceilings will be lower than the previous price ceilings.
The difference between price action and indicators
The candlestick patterns used in price action analysis are mostly based on the behavior of market traders. In simpler terms, the desire to buy or sell, or even the lack of decision of investors in the market, can form various candlestick patterns.
In addition to examining the price action, which is done based on the behavior of traders, other influential factors can be considered and examined in the market with various formulas. For example, in addition to analyzing supply and demand, by examining the behavior of the price, it is possible to find out its possible future behavior.
In simpler words, the price action analysis is derived from the current information in the market, while considering the past price behavior and various averages, the price behavior in certain periods of the future can also be guessed. This action is performed by various indicators. In general, the main difference between price action and indicators is the ability to predict future prices.
Conclusion
The most important feature of Price action is to simplify charts for traders, and there is no need to use indicators to determine entry and exit points. But using indicators can help the trader to analyze the market more accurately and ensure the results obtained. According to their performance, each of the indicators issues signals that help in deciding to enter or exit the trade.
We are glad to say that Asiasignal’s VIP channel is here to help you while facing any problem. Asiasignal’s VIP indicator can be the most perfect thing for you to buy. Be a part of Asiasignal’s premium account of trading view. Don’t forget to share Asiasignal’s VIP channel with your friends who are looking for trustworthy information.


Comments